The National Oceanic and Atmospheric Administration (NOAA) recently released its annual State of the Arctic Report, showing that the Arctic region is changing rapidly in a number of ways. Scientists say the changes make it unlikely the Arctic will return to its former state.
The images below show some of the ways the Arctic is transforming.
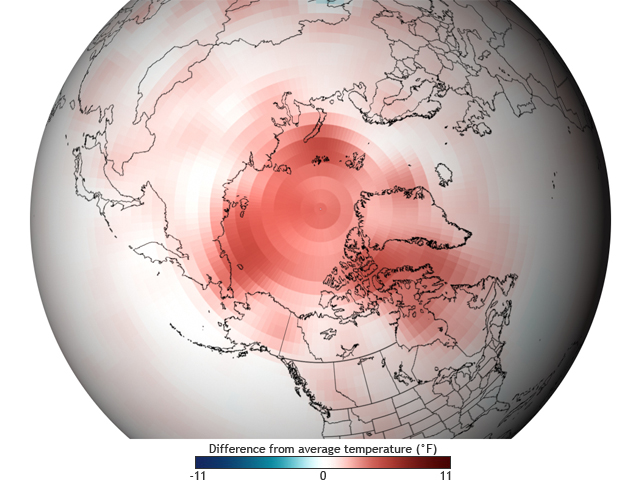 The map above shows the difference from average temperatures in the Arctic for the first decade of the 21st century as compared to 1971-2000. Over the span of a decade, no part of the Arctic was cooler than the long-term average.
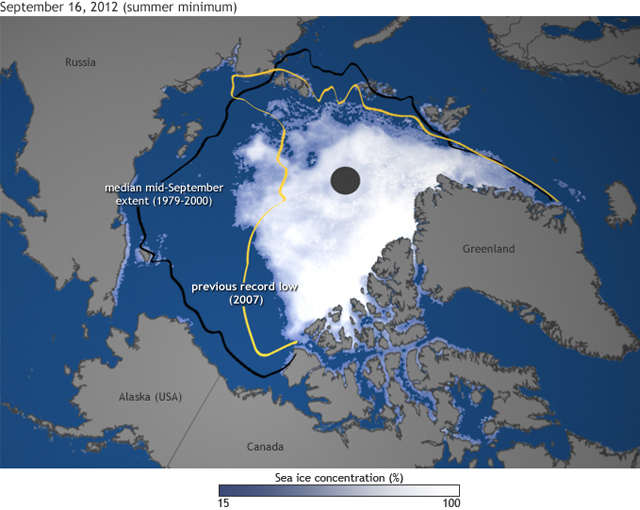 The Arctic ice cap broke the previous record low, set in summer 2007, and there were still several more weeks to go in the melt season. Arctic sea ice extent shrank to 1.58 million square miles (4.1 million square kilometers).
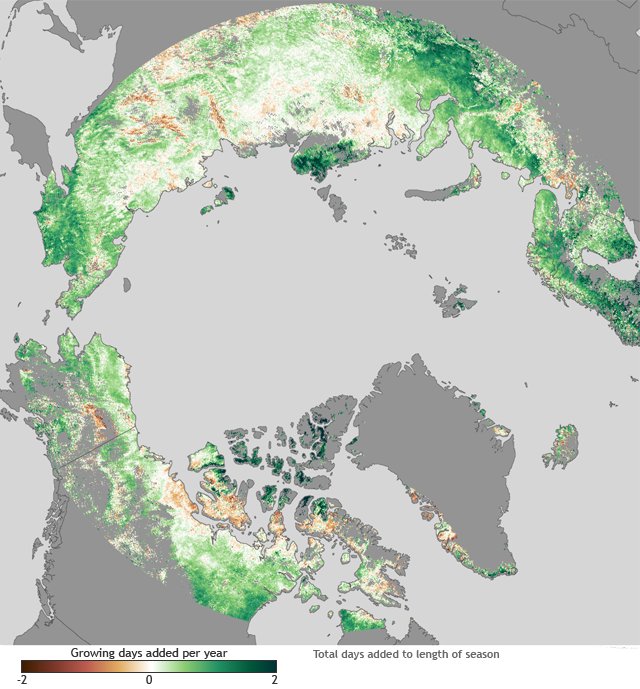
The map above shows changes in the length of the growing season in high northern latitudes based on satellite observations of “greenness” between 1982-2008. Green indicates places where the growing season increased by up to 2 days per
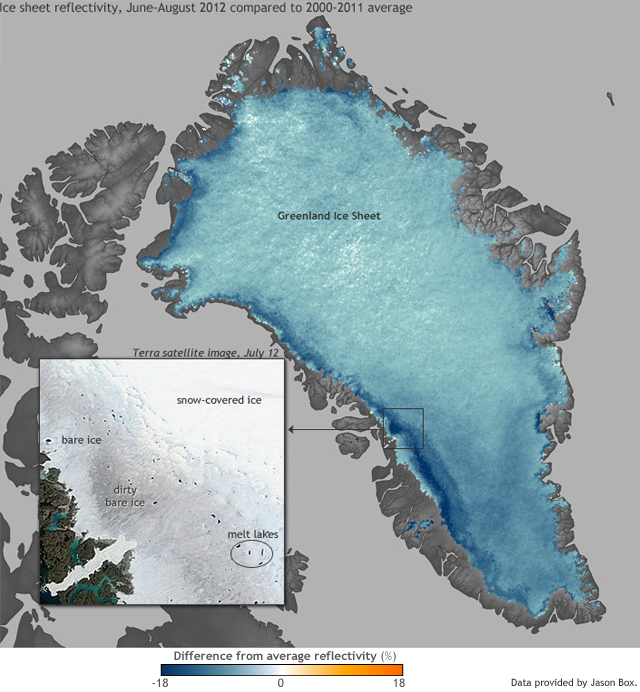 The map above shows the percent of incoming sunlight Greenland reflected during June through August 2012 compared to the average of summers from 2000-2011. Blue indicates less sunlight reflected than average, with dark blue indicating nearly 20 percent less sunlight than average reflected back into space. The inset shows the surface of the ice sheet on July 12, 2012, and it illustrates some of the ways warmer temperatures make the ice sheet less reflective, including loss of snow cover, exposure of grayish ice and melt lakes and other liquid water percolating through the ice.
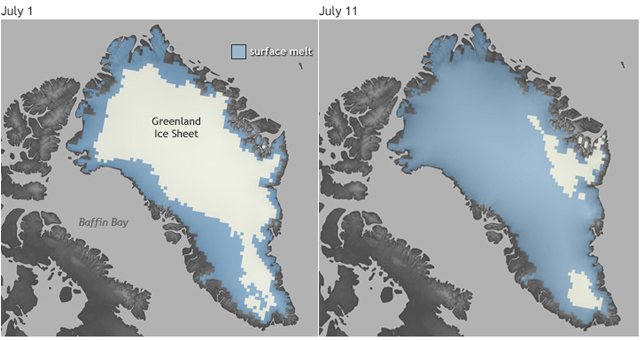
A massive ice sheet almost completely covers Greenland, and as summer temperatures climb and days lengthen, parts of the ice sheet surface usually melt, especially at lower elevations near the coast. The summer of 2012, however, brought far more extensive melt than anything observed in the satellite record. In July 2012, surface melt extended over nearly the entire ice sheet. The melt was not just around the edges, but also on the high-elevation center. These images compare surface-melt conditions on the Greenland Ice Sheet on July 1, 2012 (left), and July 11, 2012 (right).
The images below show some of the ways the Arctic is transforming.
The map above shows changes in the length of the growing season in high northern latitudes based on satellite observations of “greenness” between 1982-2008. Green indicates places where the growing season increased by up to 2 days per
A massive ice sheet almost completely covers Greenland, and as summer temperatures climb and days lengthen, parts of the ice sheet surface usually melt, especially at lower elevations near the coast. The summer of 2012, however, brought far more extensive melt than anything observed in the satellite record. In July 2012, surface melt extended over nearly the entire ice sheet. The melt was not just around the edges, but also on the high-elevation center. These images compare surface-melt conditions on the Greenland Ice Sheet on July 1, 2012 (left), and July 11, 2012 (right).